 | I had the idea of splitting the cross-entropy difference into two sums (positive and negative; or the PPL into two ratios >1 and <1) while doing PPL evals of uncensored GGUFs. The inspiration came from looking at the area under the PPL ratio convergence plot (2nd graph) and thinking "what if I scattered the positive and negative area in 2D?". After all:
In other words, smaller Y are closer to the original model, and bigger X are more uncensored. I'll leave the interpretation of the graphs up to you. * All the models are Q8_0 except for the Q8_K. The reference is always a static quant from mradermacher. * Only the BPB (Bits-per-Bytes) subplots are normalized and comparable across all 3 models. Notes:
I have confirmed that this produces an identical Mean plot in my setup. But the real trick is computing per-token signed deltas along the sequence length to obtain a positive/negative delta sum for each file (recovering the shape information that is lost in the PPL mean). This is how I was able to scatter the whole dataset and visualize contours, I am essentially scattering The smart way to do that would be to recompile My dataset for this was about 1/3 code, 1/3 multilingual, 1/3 nsfw(AO3)/4chan/anarchy cookbooks... so not the greatest uncensored dataset, but this is the flaw of using PPL, you can't run k-Refusals with tiny prompts, you need actual (high-quality) documents to run it. The first mistake I made was evaluating gemma with a stale The second mistake was not understanding chunked vs strided perplexity and being confused about how the tool operates until basically the end. Extras: Dumping the failed experiment that led to this here:
[link] [comments] |
Qwen3.5-4B|Gemma4-E2B/E4B uncensored models comparison
Reddit r/LocalLLaMA / 4/18/2026
💬 OpinionSignals & Early TrendsIdeas & Deep AnalysisTools & Practical UsageModels & Research
Key Points
- The post compares uncensored GGUF language models (Qwen3.5-4B and Gemma4 variants) by analyzing perplexity (PPL) deltas against a fixed reference/base quantization.
- It proposes a way to separate performance differences into “gain” (negative delta) and “loss” (positive delta) components to better interpret uncensored capability versus potential degradation/fine-tuning.
- The author links model behavior to graph geometry by scattering positive/negative PPL areas in 2D to recover distribution/shape information that is otherwise lost in mean PPL.
- The comparison is controlled by using mostly Q8_0 quantization (with the exception of Q8_K) and normalizing only the Bits-per-Bytes (BPB) subplots for cross-model comparability.
- It includes practical notes on computing signed deltas and averages from `llama-perplexity.exe`, highlighting that per-token signed deltas are key to preserving more detailed information.
Related Articles

Black Hat USA
AI Business

Black Hat Asia
AI Business

The myth of Claude Mythos crumbles as small open models hunt the same cybersecurity bugs Anthropic showcased
THE DECODER
Claude Opus 4.7 vs 4.6: What Actually Changed and What Breaks on Migration
Dev.to
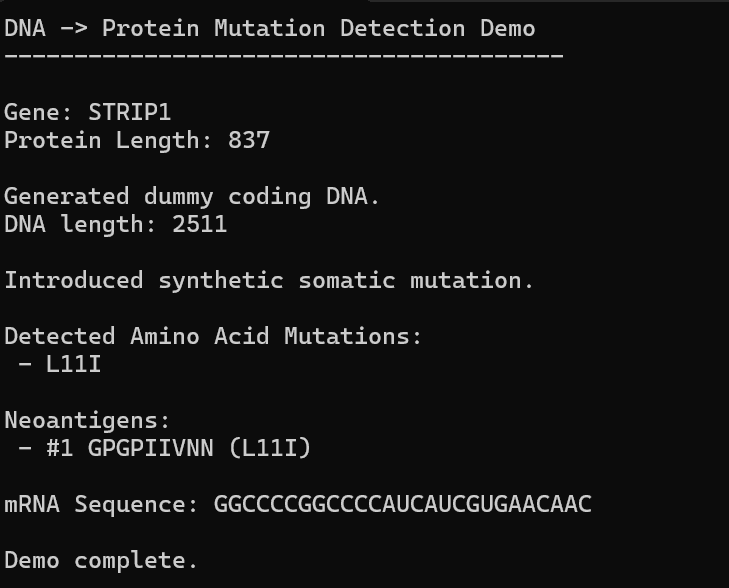
AI, Hope, and Healing: Can We Build Our Own Personalized mRNA Cancer Vaccine Pipeline?
Dev.to